I have noticed this little picture doing the rounds of Facebook lately:
Source: The Australia Institute
It says that Australia is the 3rd biggest recipient of its own foreign aid. Whilst this may be technically accurate (though it isn’t, see below), it is incredibly misleading. In the interest of perspective, here is the media release in which the $375.1 million was announced.
According to the media release, the money is used to support asylum seekers in Australia before they have been processed.
There are two quotes from that release worth noting:
- “Australia’s aid expenditure for the financial year 2012/13 will be a record $5.2 billion“. Whilst the asylum seekers in Australia awaiting processing may be the third largest recipient of money (though they are not), it still only totals about 7% of the total funds.
- “It is legitimate aid delivered in accordance with OECD guidelines and is consistent with the practice of other OECD countries including the United States ($895 million in 2010); France ($435 million in 2010); Sweden ($397 million in 2010); Netherlands ($339 million in 2010); Norway ($335 million in 2010); and Canada ($284 million in 2010).“
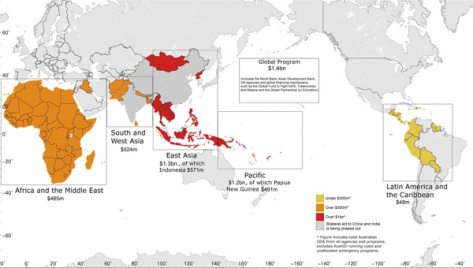
Oh, and the infographic also forgot to mention $1.4 billion going to a “global program”, which is aid not tied to any specific country.For reference, here is the distribution of foreign aid, according to the source (AusAID) for the 2012-13 budget:
Source: Ausaid
It is also worth noting that of the 46 OECD nations listed as donors, Australia ranks 9th by amount donated:
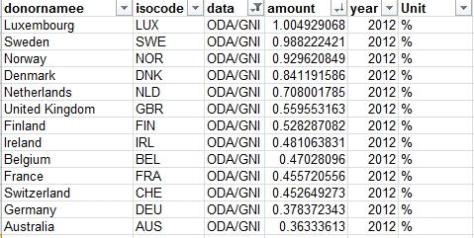
And 13th on aid as a percentage of GNI:
Source: OECD Aid statistics by donor and sector – interactive charts
This last point matters, because it is very hard for people to easily assess a single figure in isolation – we work best having something to compare to. If the info-graphic had mentioned that Australia was in the top 10 OECD donors, or in the top 1/3 by percentage GNI, it would have a very different impact (hence the reason these particular facts were omitted…)
This blog entry is not a comment on whether Australia should increase or decrease its foreign aid spending; it is merely an example of how information can be presented in a biased or misleading way to influence people.


